The top two teams on the points table will qualify for the final at Lord’s in 2025. With South Africa and Australia currently leading, other teams like India and New Zealand must secure consistent victories to keep their final hopes alive.
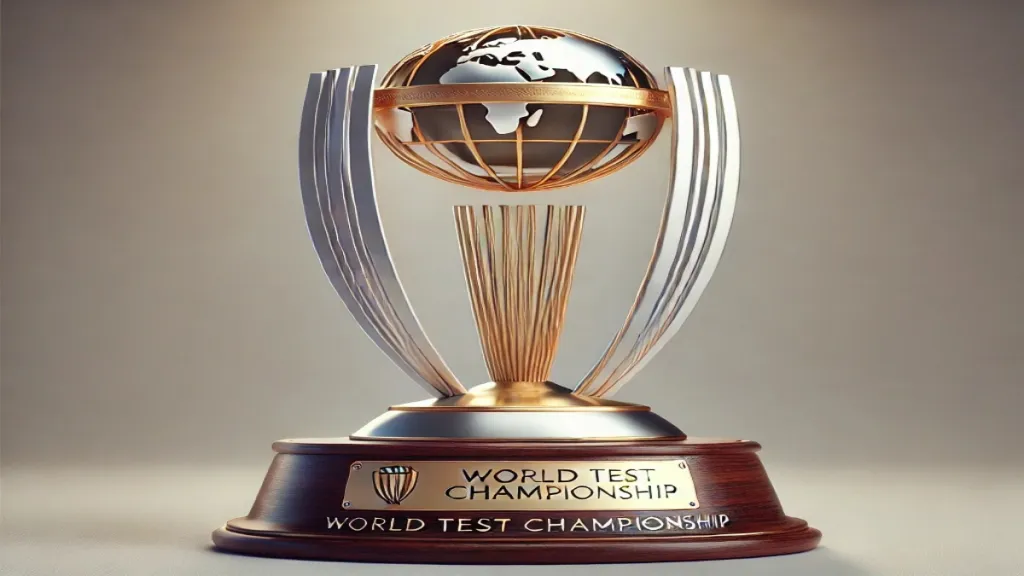
The World Test Championship (WTC) for the 2023-2025 cycle is heating up as teams compete for the coveted top two spots to qualify for the final at Lord’s in 2025. Here’s a breakdown of the current standings, performance highlights, and the points system that determines the rankings.
Points Percentage (PCT): 66.67% South Africa has emerged as a strong contender, leading the table with consistent performances and a high PCT. Their balanced team dynamics and strategic wins have given them the edge.
Australia
Matches Played: 17
Wins: 11 | Losses: 4 | Draws: 2
Points: 130
PCT: 63.73% Australia remains a dominant force in Test cricket, sitting comfortably in second place. With a robust batting lineup and an effective bowling attack, they are poised to challenge for the top spot.
PCT: 50.00% India’s position reflects a mixed bag of results, highlighting inconsistencies in both batting and bowling. While young talents have shown promise, the team needs stronger collective performances to stay in contention for the final.
PCT: 48.21% New Zealand’s campaign has been evenly balanced with equal wins and losses. Their path to the final depends on sustained success in upcoming matches.
Sri Lanka
Matches Played: 11
Wins: 5 | Losses: 6 | Draws: 0
Points: 60
PCT: 45.45% Sri Lanka’s position shows potential but lacks consistency. They must deliver decisive victories to remain competitive
The Stragglers: England, Bangladesh, Pakistan and West Indies
Comments
Post a Comment